DENVER–(BUSINESS WIRE)–Newmont Corporation (NYSE: NEM, TSX: NGT, ASX: NEM, PNGX: NEM) reported higher gold Mineral Reserves (“reserves”) of 135.9 million attributable ounces for 2023 compared to the Company’s 96.1 million ounces at the end of 2022. Newmont has significant upside to other metals, including more than 30 billion pounds of copper reserves and nearly 600 million ounces of silver reserves.


“Newmont has strengthened its position as the responsible gold leader with the industry’s highest concentration of quality operations, reserves and resources,” said Tom Palmer, Newmont’s President and Chief Executive Officer. “In 2023, we added more than 47 million ounces of gold reserves and 14 billion pounds of copper reserves through the acquisition of Newcrest and the continuation of our industry-leading exploration program. With the largest gold and copper reserve base in the industry, Newmont is well-positioned to deliver stable production and meaningful value to stakeholders today and in the future.”
2023 Reserves & Resources Highlights
- Robust gold reserves of 135.9 million ounces
- Newcrest acquisition accounted for net addition of 44 million ounces of gold reserves in 2023 (net of revisions)
- Nearly all gold and copper reserves and resources are attributable to the Newmont Tier 1 Portfolio1
- Underpinned by a strong base of operating sites with gold reserve life of 10 years or more, including Boddington, Lihir, Cadia, Tanami, Ahafo, Merian, Pueblo Viejo and Nevada Gold Mines (NGM), and further enhanced by Newmont’s broader portfolio and organic project pipeline
- Measured & Indicated Gold Mineral Resources of 104.8 million ounces and Inferred Resources of 69.1 million ounces
- Significant exposure to copper with 30.1 billion pounds in reserves, 33.1 billion pounds in Measured & Indicated resources and 24.0 billion pounds in Inferred resources; nearly all copper reserves and resources are attributable to the Newmont Tier 1 Portfolio1
- Additional exposure to other metals including silver, lead, zinc, and molybdenum
Percentage of Gold Reserves by Jurisdiction2
Newmont’s reserve base is a key differentiator with an average reserve grade of 0.97 grams per tonne and an operating reserve life of more than ten years at six managed sites and two non-managed joint ventures, with significant upside potential from a robust organic project pipeline. In addition, Newmont has substantial exposure to other metals, with 112 million gold equivalent ounces3 of reserves from copper, silver, lead, zinc, and molybdenum.
| PROVEN AND PROBABLE GOLD RESERVES1 | |||
| In thousands of ounces | |||
| 2022 Gold Reserves |
96.1 |
||
| Additions |
2.8 |
||
| Acquisitions4 |
55.9 |
||
| Net Revisions |
(11.6 |
) |
|
| Depletion |
(7.3 |
) |
|
| 2023 Gold Reserves |
135.9 |
||
For 2023, Newmont reported 135.9 million ounces of gold Mineral Reserves, a 41 percent increase from the prior year total of 96.1 million ounces. The acquisition of Newcrest drove the increase by adding a net 44.3 million ounces after revisions, primarily due to changes in regulatory requirements and technical assumptions.
The gold reserve increases were primarily driven by Lihir and Cadia acquired in the Newcrest transaction; notably,
- Lihir added 17.5 million ounces of reserves, with a projected mine life of 16 years
- Cadia added 14.7 million ounces of reserves, with a projected mine life of 34 years
These increases were supported by over 3 million ounces at the Brucejack mine, over 5 million ounces at the Wafi-Golpu project and nearly 4 million ounces the Red Chris project.
Newmont’s legacy sites had additions through drilling of 2.2 million ounces, which were offset by net negative revisions of 1.8 million ounces driven by Peñasquito, Tanami, Musselwhite and Ahafo. Peñasquito site had net negative revisions of 0.6 million ounces, before depletion, primarily due to an updated resource model that will further support future production planning. Sites including Éléonore, Porcupine, Cerro Negro and Merian substantially replaced depletion.
Newmont’s 38.5 percent interest in NGM represented 18.3 million attributable ounces of gold reserves at year end, compared to 18.6 million ounces at the end of 2022. Newmont’s 40 percent interest in Pueblo Viejo represented 8.0 million attributable ounces of gold reserves at year end, compared to 8.2 million ounces at the end of 2022.
Gold reserve grade decreased 10 percent to 0.97 grams per tonne compared to 1.09 grams per tonne in the prior year, primarily due to the lower grade of the acquired Newcrest assets.
|
GOLD RESOURCES5 |
|||
| In thousands of ounces | |||
| 2022 Gold Resources |
111.5 |
||
| Additions |
5.8 |
||
| Acquisitions4 |
74.6 |
||
| Net Revisions |
(11.9 |
) |
|
| Conversions |
(6.1 |
) |
|
| 2023 Gold Resources |
173.9 |
||
In 2023, Newmont reported Measured and Indicated Gold Mineral Resources of 104.8 million ounces, a 39 percent increase from the prior year total of 75.3 million ounces. Inferred Gold Mineral Resources totaled 69.1 million ounces, a 91 percent increase from the prior year total of 36.1 million ounces. The Newcrest acquisition added a total of 66.1 million ounces of resource growth to the Newmont portfolio, with reported Measured and Indicated Gold Mineral Resources of 32.3 million ounces and Inferred Gold Mineral Resources of 33.8 million ounces.
Total Mineral Resources at Newmont’s legacy sites were largely unchanged from 2022, with 90.4 million ounces in 2023 compared to 92.3 million ounces in 2022. Significant growth in resources was supported by the acquisition of the Tier 1 assets at Cadia and Lihir, with the addition of 20.6 and 20.2 million ounces, respectively. The newly acquired projects of Wafi-Golpu, Namosi and Red Chris contributed nearly 17 million ounces of total resources.
Total Mineral Resources at Tanami increased by approximately 1.0 million ounces due to the addition of the Oberon Underground project. Total Mineral Resources at Peñasquito decreased by 2.2 million ounces due to the updated resource model and technical assumptions that resulted in the removal of a resource layback at the Peñasco pit. The layback could come back into Mineral Resources pending additional optimization work, including cost reductions, metallurgical recovery enhancements and metal price increases.
Newmont’s Measured and Indicated Gold Mineral Resource grade decreased to 0.57 grams per tonne compared to 0.67 grams per tonne in the prior year. Inferred Gold Mineral Resource grade of 0.6 grams per tonne decreased compared to 0.7 grams per tonne in the prior year.
OTHER METALS
In 2023, copper reserves and resources increased significantly, primarily due to the addition of the assets acquired in the Newcrest transaction, particularly Cadia, Wafi-Golpu and Red Chris. Copper reserves increased to 30.1 billion pounds from 15.7 billion pounds in the prior year, with a 20 percent increase in reserve grade from 0.29% in 2022 to 0.35% in 2023. Measured and Indicated copper resources increased to 33.1 billion pounds from 17.9 billion pounds. Inferred copper resources increased to 24.0 billion pounds from 8.6 billion pounds.
Silver reserves were largely stable at 596 million ounces compared to 593 million ounces in the prior year, primarily due to the addition of the assets acquired in the Newcrest transaction, specifically Brucejack and Cadia, which offset depletion and negative revisions at Peñasquito as a result of the updated resource model. Silver resources decreased during the year due to the impact of the negative revisions at Peñasquito, which were partially offset by the Newcrest asset additions. Measured and Indicated silver resources decreased to 457 million ounces from 500 million ounces in the prior year. Inferred silver resources decreased to 108 million ounces from 152 million ounces in the prior year.
Lead and zinc reserves and resources were impacted by the updated resource model at Peñasquito. Lead reserves decreased to 2.1 billion pounds from 2.3 billion pounds, Measured and Indicated lead resources decreased to 1.4 billion pounds from 1.6 billion pounds, and Inferred lead resources decreased to 100 million pounds from 440 million pounds in the prior year. Zinc reserves decreased to 4.9 billion pounds from 5.5 billion pounds, Measured and Indicated zinc resources decreased to 3.3 billion pounds from 3.7 billion pounds, and Inferred zinc resources decreased to 0.3 billion pounds from 1.0 billion pounds in the prior year.
Molybdenum reserves of 500 million pounds were declared in the current year due to the addition of the operating site at Cadia. Measured and Indicated molybdenum resources increased to 200 million pounds, with Inferred molybdenum resources of 100 million pounds.
NOTES ON NEWMONT’S DECLARATION
Newmont has reported the assets acquired in the Newcrest transaction in accordance with the Securities and Exchange Commission’s (SEC’s) rule S-K 1300 which has different requirements than those in the Joint Ore Reserves Committee (JORC) 2012 guidance, which was the ruling the assets were previously declared under. These differences include a requirement to report only the attributable portion of the company’s Mineral Reserves and Mineral Resources and to report Mineral Resources as Exclusive of Reserves, whereas the previous declaration of Mineral Resources were at 100% and included the metal also declared as Mineral Reserves.
EXPLORATION OUTLOOK
Newmont’s attributable exploration expenditure for managed operations is expected to be approximately $270 million in 2024 with 70 percent of total exploration investment dedicated to near-mine expansion programs and brownfields and the remaining 30 percent allocated to the advancement of greenfield projects.
Additionally, Newmont’s share of exploration investment for its non-managed operations is expected to be approximately $30 million, for a total consolidated exploration expense outlook of $300 million for 2024.
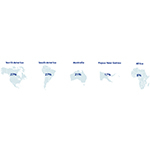
Geographically, the Company expects to invest approximately 27 percent in North America, 22 percent in Australia, 21 percent in South America and the remainder in Papua New Guinea, Africa and other locations.
GOLD RESERVE SENSITIVITY
A $100 increase in gold price would result in an approximate 5 percent increase in gold reserves while a $100 decrease in gold price would result in an approximate 6 percent decrease in gold reserves. These sensitivities assume an oil price of $75 per barrel (WTI), Australian dollar exchange rate of $0.70 and Canadian dollar exchange rate of $0.75. These sensitivities assume all other inputs remain equal, including all cost and capital assumptions, which may also have a material impact on these approximate estimates.
|
KEY RESERVE AND RESOURCE ASSUMPTIONS6 |
|||
|
At December 31, |
|||
|
2023 |
2022 |
||
|
Gold Reserves ($/oz) |
$1,400 |
$1,400 |
|
|
Gold Resources ($/oz) |
$1,600 |
$1,600 |
|
|
Copper Reserves ($/lb) |
$3.50 |
$3.50 |
|
|
Copper Resources ($/lb) |
$4.00 |
$4.00 |
|
|
Silver Reserves ($/oz) |
$20.00 |
$20.00 |
|
|
Silver Resources ($/oz) |
$23.00 |
$23.00 |
|
|
Lead Reserves ($/lb) |
$1.00 |
$1.00 |
|
|
Lead Resources ($/lb) |
$1.20 |
$1.20 |
|
|
Zinc Reserves ($/lb) |
$1.20 |
$1.20 |
|
|
Zinc Resources ($/lb) |
$1.45 |
$1.45 |
|
|
Molybdenum Reserves ($/lb) |
$8.00 |
— |
|
|
Molybdenum Resources ($/lb) |
$10.00 |
— |
|
|
Tungsten Resources ($/lb) |
$16.00 |
— |
|
|
Australian Dollar (A$:US$) |
$0.70 |
$0.75 |
|
|
Canadian Dollar (C$:US$) |
$0.75 |
$0.80 |
|
|
West Texas Intermediate ($/bbl) |
$75.00 |
$85.00 |
|
For additional details on Newmont’s reported gold, copper, silver, lead, zinc, molybdenum and tungsten Mineral Reserves and Mineral Resources, please refer to the tables at the end of this release.
| _________________________ |
|
1 Newmont’s go-forward portfolio is focused on Tier 1 assets, consisting of (1) six managed Tier 1 assets (Boddington, Tanami, Cadia, Lihir, Peñasquito and Ahafo), (2) assets owned through two non-managed joint ventures at Nevada Gold Mines and Pueblo Viejo, including four Tier 1 assets (Carlin, Cortez, Turquoise Ridge and Pueblo Viejo), (3) three emerging Tier 1 assets (Merian, Cerro Negro and Yanacocha), which do not currently meet the criteria for Tier 1 Asset, and (4) an emerging Tier 1 district in the Golden Triangle in British Columbia (Red Chris and Brucejack), which does not currently meet the criteria for Tier 1 Asset. Newmont’s Tier 1 portfolio also includes attributable production from the Company’s equity interest in Lundin Gold (Fruta del Norte). Tier 1 Portfolio cost and capital metrics include the proportional share of the Company’s interest in the Nevada Gold Mines Joint Venture. |
|
2 North America includes 38.5 percent interest in Nevada Gold Mines; South America includes Newmont’s 40 percent interest in Pueblo Viejo. |
|
3 Gold Equivalent Ounces (GEOs) are calculated using 2023 Mineral Reserve pricing for Gold ($1,400/oz.), Copper ($3.50/lb.), Silver ($20.00/oz.), Lead ($1.00/lb.), Zinc ($1.20/lb.) and Molybdenum ($8.00/lb.) and Resource pricing for Gold ($1,600/oz.), Copper ($4.00/lb.), Silver ($23.00/oz.), Lead ($1.20/lb.), Zinc ($1.45/lb.), Molybdenum ($10.00/lb.), Tungsten ($16.00/lb.) and metallurgical recoveries for each metal on a site by site basis, as metal * [(metal price * metal recovery) / (gold price * gold recovery)]. |
|
4 In 2023, Newmont completed the acquisition of Newcrest Mining Limited (“Newcrest”). |
|
5 Includes Measured and Indicated Gold Mineral Resources and Inferred Gold Mineral Resources. |
|
6 For 2023 and 2022, Newmont reserves and resources were estimated using the price assumptions noted above, except for certain sites acquired through the Newcrest transaction, which have used more conservative price assumptions. Refer to the reserves and resources tables below for additional details. |
RESERVE AND RESOURCE TABLES
Proven and probable reserves are based on extensive drilling, sampling, mine modeling and metallurgical testing from which Newmont determined economic feasibility. The reference point for mineral reserves is the point of delivery to the process plant. Metal price assumptions, adjusted for Newmont’s exchange rate assumption, are based on considering such factors as market forecasts, industry consensus and management estimates. The price sensitivity of reserves depends upon several factors including grade, metallurgical recovery, operating cost, waste-to-ore ratio and ore type. Metallurgical recovery rates vary depending on the metallurgical properties of each deposit and the production process used. The reserve tables below list the average metallurgical recovery rate for each deposit, which takes into account the relevant processing methods. The cut-off grade, or lowest grade of mineralization considered economic to process, varies between deposits depending upon prevailing economic conditions, mineability of the deposit, by-products, amenability of the ore to gold, copper, silver, lead, zinc or molybdenum extraction and type of milling or leaching facilities available. Reserve estimates may have non-material differences in comparison to our joint venture partners due to differences in classification and rounding methodology.
The proven and probable reserve figures presented herein are estimates based on information available at the time of calculation. No assurance can be given that the indicated levels of recovery of gold, copper, silver, lead, zinc and molybdenum will be realized. Ounces of gold or silver or pounds of copper, lead, zinc or molybdenum included in the proven and probable reserves are those contained prior to losses during metallurgical treatment. Reserve estimates may require revision based on actual production. Market fluctuations in the price of gold, copper, silver, lead, zinc and molybdenum, as well as increased production costs or reduced metallurgical recovery rates, could render certain proven and probable reserves containing higher cost reserves uneconomic to exploit and might result in a reduction of reserves.
The measured, indicated, and inferred resource figures presented herein are estimates based on information available at the time of calculation and are exclusive of reserves. A “mineral resource” is a concentration or occurrence of solid material of economic interest in or on the Earth’s crust in such form, grade, or quality and quantity that there are reasonable prospects for eventual economic extraction. The location, quantity, grade or quality, continuity and other geological characteristics of a mineral resource are known, estimated or interpreted from specific geological evidence and knowledge, including sampling. The reference point for mineral resources is in situ. Mineral resources are sub-divided, in order of increasing geological confidence, into inferred, indicated and measured categories. Ounces of gold and silver or pounds of copper, zinc, lead, molybdenum and tungsten included in the measured, indicated and inferred resources are those contained prior to losses during metallurgical treatment. The terms “measured resource,” “indicated resource,” and “inferred resource” mean that part of a mineral resource for which quantity and grade or quality are estimated on the basis of geological evidence and sampling that is considered to be comprehensive, adequate, or limited, respectively. Market fluctuations in the price of gold, silver, copper, zinc, lead, molybdenum and tungsten as well as increased production costs or reduced metallurgical recovery rates, could change future estimates of resources.
Newmont publishes reserves annually, and will recalculate reserves at December 31, 2024, taking into account metal prices, changes, if any, to future production and capital costs, divestments and depletion as well as any acquisitions and additions during 2024.
Please refer to the reserves and resources cautionary statement at the end of the release.
|
Gold Reserves (1) |
|||||||||||||||||||
|
December 31, 2023 |
December 31, 2022 |
||||||||||||||||||
|
Proven Reserves |
Probable Reserves |
Proven and Probable Reserves |
Proven and Probable Reserves |
||||||||||||||||
|
Deposits/Districts |
Newmont |
Tonnage (2) |
Grade |
Ounces (3) |
Tonnage (2) |
Grade |
Ounces (3) |
Tonnage (2) |
Grade |
Ounces (3) |
Metallurgical |
Tonnage (2) |
Grade |
Ounces (3) |
|||||
|
CC&V Open Pit |
100% |
38,800 |
0.42 |
500 |
7,800 |
0.35 |
100 |
46,600 |
0.40 |
600 |
58% |
61,400 |
0.37 |
740 |
|||||
|
CC&V Leach Pads (4) |
100% |
— |
— |
— |
28,300 |
0.74 |
700 |
28,300 |
0.74 |
700 |
56% |
32,600 |
0.78 |
820 |
|||||
|
Total CC&V, United States (5) |
38,800 |
0.42 |
500 |
36,100 |
0.66 |
800 |
75,000 |
0.53 |
1,300 |
57% |
94,000 |
0.52 |
1,560 |
||||||
|
Musselwhite, Canada (6) |
100% |
3,200 |
6.78 |
700 |
3,800 |
6.30 |
800 |
7,000 |
6.52 |
1,500 |
96% |
10,400 |
5.76 |
1,920 |
|||||
|
Porcupine Underground (7) |
100% |
1,400 |
7.06 |
300 |
1,600 |
8.34 |
400 |
3,000 |
7.75 |
700 |
94% |
2,500 |
8.49 |
690 |
|||||
|
Porcupine Open Pit (8) |
100% |
3,200 |
1.43 |
100 |
26,600 |
1.54 |
1,300 |
29,700 |
1.53 |
1,500 |
93% |
34,500 |
1.46 |
1,610 |
|||||
|
Total Porcupine, Canada |
4,500 |
3.14 |
500 |
28,200 |
1.93 |
1,700 |
32,700 |
2.10 |
2,200 |
93% |
37,000 |
1.93 |
2,300 |
||||||
|
Éléonore, Canada (9) |
100% |
2,100 |
5.08 |
300 |
6,800 |
5.47 |
1,200 |
8,900 |
5.38 |
1,500 |
92% |
9,400 |
5.22 |
1,570 |
|||||
|
Red Chris Open Pit |
70% |
— |
— |
— |
30,200 |
0.37 |
300 |
30,200 |
0.37 |
300 |
53% |
— |
— |
— |
|||||
|
Red Chris Underground |
70% |
— |
— |
— |
171,700 |
0.64 |
3,500 |
171,700 |
0.64 |
3,500 |
70% |
— |
— |
— |
|||||
|
Total Red Chris, Canada (10)(33) |
— |
— |
— |
201,900 |
0.60 |
3,900 |
201,900 |
0.60 |
3,900 |
68% |
— |
— |
— |
||||||
|
Brucejack, Canada (11)(33) |
100% |
— |
— |
— |
11,500 |
8.44 |
3,100 |
11,500 |
8.44 |
3,100 |
96% |
— |
— |
— |
|||||
|
Peñasquito, Mexico (12)(31) |
100% |
123,700 |
0.57 |
2,200 |
167,300 |
0.44 |
2,400 |
291,000 |
0.50 |
4,600 |
59% |
316,500 |
0.53 |
5,410 |
|||||
|
Merian, Suriname (13) |
75% |
29,600 |
1.19 |
1,100 |
74,400 |
1.15 |
2,800 |
104,000 |
1.16 |
3,900 |
93% |
104,800 |
1.16 |
3,900 |
|||||
|
Cerro Negro, Argentina (14) |
100% |
1,900 |
11.81 |
700 |
7,300 |
10.75 |
2,500 |
9,200 |
10.97 |
3,200 |
94% |
9,400 |
10.02 |
3,030 |
|||||
|
Yanacocha Open Pit (15) |
100% |
21,700 |
0.80 |
600 |
107,000 |
0.75 |
2,600 |
128,600 |
0.76 |
3,200 |
56% |
146,500 |
0.72 |
3,380 |
|||||
|
Yanacocha Underground (16) |
100% |
— |
— |
— |
12,300 |
6.06 |
2,400 |
12,300 |
6.06 |
2,400 |
97% |
12,300 |
6.06 |
2,400 |
|||||
|
Total Yanacocha, Peru (31) |
21,700 |
0.80 |
600 |
119,200 |
1.30 |
5,000 |
140,900 |
1.22 |
5,500 |
73% |
158,800 |
1.13 |
5,780 |
||||||
|
Pueblo Viejo Open Pit |
40% |
25,800 |
2.28 |
1,900 |
50,800 |
2.08 |
3,400 |
76,600 |
2.15 |
5,300 |
82% |
78,500 |
2.19 |
5,530 |
|||||
|
Pueblo Viejo Stockpiles (17) |
40% |
— |
— |
— |
39,700 |
2.12 |
2,700 |
39,700 |
2.12 |
2,700 |
83% |
38,200 |
2.17 |
2,670 |
|||||
|
Total Pueblo Viejo, Dominican Republic (18)(31) |
25,800 |
2.28 |
1,900 |
90,500 |
2.10 |
6,100 |
116,300 |
2.14 |
8,000 |
82% |
116,600 |
2.19 |
8,200 |
||||||
|
NuevaUnión, Chile (19)(30) |
50% |
— |
— |
— |
341,100 |
0.47 |
5,100 |
341,100 |
0.47 |
5,100 |
66% |
341,100 |
0.47 |
5,110 |
|||||
|
Norte Abierto, Chile (20)(30) |
50% |
— |
— |
— |
598,800 |
0.60 |
11,600 |
598,800 |
0.60 |
11,600 |
74% |
598,800 |
0.60 |
11,620 |
|||||
|
Boddington Open Pit |
100% |
215,300 |
0.67 |
4,600 |
192,600 |
0.64 |
3,900 |
407,900 |
0.66 |
8,600 |
85% |
446,700 |
0.66 |
9,490 |
|||||
|
Boddington Stockpiles (17) |
100% |
2,000 |
0.72 |
— |
70,000 |
0.43 |
1,000 |
72,000 |
0.44 |
1,000 |
80% |
78,300 |
0.43 |
1,090 |
|||||
|
Total Boddington, Australia (10) |
217,300 |
0.67 |
4,700 |
262,600 |
0.58 |
4,900 |
479,900 |
0.62 |
9,600 |
84% |
524,900 |
0.63 |
10,580 |
||||||
|
Tanami, Australia (21) |
100% |
9,900 |
5.58 |
1,800 |
16,600 |
5.71 |
3,100 |
26,600 |
5.66 |
4,800 |
98% |
33,000 |
5.34 |
5,660 |
|||||
|
Cadia, Australia (22)(31)(33) |
100% |
— |
— |
— |
1,102,300 |
0.42 |
14,700 |
1,102,300 |
0.42 |
14,700 |
81% |
— |
— |
— |
|||||
|
Lihir Open Pits |
100% |
— |
— |
— |
159,900 |
2.76 |
14,200 |
159,900 |
2.76 |
14,200 |
78% |
— |
— |
— |
|||||
|
Lihir Stockpiles (17) |
100% |
— |
— |
— |
57,200 |
1.83 |
3,400 |
57,200 |
1.83 |
3,400 |
78% |
— |
— |
— |
|||||
|
Total Lihir, Papua New Guinea (23)(31)(33) |
— |
— |
— |
217,100 |
2.51 |
17,500 |
217,100 |
2.51 |
17,500 |
78% |
— |
— |
— |
||||||
|
Wafi-Golpu, Papua New Guinea (10)(30)(33) |
50% |
— |
— |
— |
194,500 |
0.82 |
5,100 |
194,500 |
0.82 |
5,100 |
68% |
— |
— |
— |
|||||
|
Ahafo South Open Pit (24) |
100% |
5,200 |
2.76 |
500 |
35,500 |
1.68 |
1,900 |
40,700 |
1.82 |
2,400 |
90% |
47,600 |
1.81 |
2,770 |
|||||
|
Ahafo South Underground (25) |
100% |
8,300 |
3.13 |
800 |
14,300 |
2.35 |
1,100 |
22,600 |
2.64 |
1,900 |
94% |
22,600 |
3.06 |
2,230 |
|||||
|
Ahafo South Stockpiles (17)(26) |
100% |
23,400 |
1.01 |
800 |
— |
— |
— |
23,400 |
1.01 |
800 |
91% |
22,100 |
0.91 |
640 |
|||||
|
Total Ahafo South, Ghana |
36,900 |
1.73 |
2,100 |
49,800 |
1.88 |
3,000 |
86,700 |
1.82 |
5,100 |
92% |
92,300 |
1.90 |
5,650 |
||||||
|
Ahafo North, Ghana (27) |
100% |
26,000 |
2.38 |
2,000 |
27,100 |
2.43 |
2,100 |
53,100 |
2.41 |
4,100 |
91% |
50,100 |
2.37 |
3,820 |
|||||
|
Akyem Open Pit |
100% |
13,000 |
1.52 |
600 |
5,900 |
1.61 |
300 |
19,000 |
1.55 |
900 |
90% |
22,300 |
1.66 |
1,190 |
|||||
|
Akyem Stockpiles (17) |
100% |
6,700 |
0.78 |
200 |
— |
— |
— |
6,700 |
0.78 |
200 |
90% |
11,900 |
0.71 |
270 |
|||||
|
Total Akyem, Ghana (28) |
19,700 |
1.27 |
800 |
5,900 |
1.61 |
300 |
25,600 |
1.35 |
1,100 |
90% |
34,200 |
1.33 |
1,460 |
||||||
|
NGM Open Pit |
38.5% |
— |
— |
— |
154,700 |
1.01 |
5,000 |
154,700 |
1.01 |
5,000 |
77% |
159,400 |
1.00 |
5,110 |
|||||
|
NGM Stockpiles (17) |
38.5% |
15,100 |
2.01 |
1,000 |
14,000 |
2.44 |
1,100 |
29,100 |
2.22 |
2,100 |
69% |
25,100 |
2.32 |
1,880 |
|||||
|
NGM Underground |
38.5% |
5,100 |
11.58 |
1,900 |
35,100 |
8.19 |
9,300 |
40,200 |
8.62 |
11,100 |
87% |
41,300 |
8.75 |
11,610 |
|||||
|
Total NGM, United States (29) |
20,200 |
4.42 |
2,900 |
203,900 |
2.35 |
15,400 |
224,100 |
2.54 |
18,300 |
82% |
225,800 |
2.56 |
18,590 |
||||||
|
Total Gold |
581,400 |
1.22 |
22,800 |
3,766,800 |
0.94 |
113,200 |
4,348,100 |
0.97 |
135,900 |
80% |
2,757,100 |
1.09 |
96,140 |
||||||
|
(1) |
Gold reserves, at sites in which Newmont is the operator for 2023 and 2022, were estimated at a gold price of $1,400 per ounce, unless otherwise noted. Reserves provided by other operators may use pricing that differs. Amounts presented may not recalculate in total due to rounding. |
|
|
(2) |
Tonnages include allowances for losses resulting from mining methods. Tonnages are rounded to the nearest 100,000. |
|
|
(3) |
Ounces are estimates of metal contained in ore tonnages and do not include allowances for processing losses. Metallurgical recovery rates represent the estimated amount of metal to be recovered through metallurgical extraction processes. Ounces may not recalculate as they are rounded to the nearest 100,000 in 2023 and nearest 10,000 in 2022. |
|
|
(4) |
Leach pad material is the material on leach pads at the end of the year from which gold remains to be recovered. In-process reserves are reported separately where ounces exceed 100,000 and are greater than 5% of the total site-reported reserves. |
|
|
(5) |
Cut-off grade utilized in 2023 reserves not less than 0.10 gram per tonne. |
|
|
(6) |
Cut-off grade utilized in 2023 reserves not less than 3.80 gram per tonne. |
|
|
(7) |
Cut-off grade utilized in 2023 reserves not less than 4.89 gram per tonne. |
|
|
(8) |
Cut-off grade utilized in 2023 reserves not less than 0.64 gram per tonne. |
|
|
(9) |
Cut-off grade utilized in 2023 reserves not less than 4.11 gram per tonne. |
|
|
(10) |
Gold cut-off grade varies with level of copper credits. |
|
|
(11) |
Gold cut-off grade varies with level of silver credits. |
|
|
(12) |
Gold cut-off grade varies with level of silver, lead, and zinc credits. |
|
|
(13) |
Cut-off grade utilized in 2023 reserves not less than 0.29 gram per tonne. |
|
|
(14) |
Cut-off grade utilized in 2023 reserves not less than 4.30 gram per tonne. |
|
|
(15) |
Gold cut-off grades utilized in 2023 reserves were as follows: oxide leach material not less than 0.14 gram per tonne and refractory mill material not less than 1.23 gram per tonne. |
|
|
(16) |
Gold cut-off grades utilized in 2023 were as follows: oxide mill material not less than 3.37 gram per tonne and refractory mill material varies with level of copper and silver credits. |
|
|
(17) |
Stockpiles are comprised primarily of material that has been set aside to allow processing of higher grade material in the mills. Stockpiles increase or decrease depending on current mine plans. Stockpile reserves are reported separately where ounces exceed 100,000 and are greater than 5% of the total site-reported reserves. |
|
|
(18) |
The Pueblo Viejo mine, which is 40% owned by Newmont, is accounted for as an equity method investment. Reserve estimates provided by Barrick, the operator of Pueblo Viejo. |
|
|
(19) |
Project is currently undeveloped. Reserve estimates provided by the NuevaUnión joint venture. |
|
|
(20) |
Project is currently undeveloped. Reserve estimates provided by the Norte Abierto joint venture. |
|
|
(21) |
Cut-off grade utilized in 2023 reserves not less than 2.40 gram per tonne. |
|
|
(22) |
Gold cut-off grade varies with level of copper, silver, and molybdenum credits. |
|
|
(23) |
Cut-off grade utilized in 2023 reserves not less than 1.20 gram per tonne. |
|
|
(24) |
Cut-off grade utilized in 2023 reserves not less than 0.63 gram per tonne. |
|
|
(25) |
Cut-off grade utilized in 2023 reserves not less than 2.20 gram per tonne. |
|
|
(26) |
Cut-off grade utilized in 2023 reserves not less than 0.56 gram per tonne. |
|
|
(27) |
Cut-off grade utilized in 2023 reserves not less than 0.58 gram per tonne. |
|
|
(28) |
Cut-off grade utilized in 2023 reserves not less than 0.52 gram per tonne. |
|
|
(29) |
Reserve estimates provided by Barrick, the operator of the NGM joint venture. |
|
|
(30) |
Currently included in Corporate and Other which includes the Company’s business activities relating to its corporate and regional offices and all equity method investments. |
|
|
(31) |
Amounts presented herein have been rounded to the nearest 100,000 in 2023 and nearest 10,000 in 2022 for ounces and 100,000 for tonnes and therefore may not agree to the respective Technical Report Summaries provided for certain properties. |
|
|
(32) |
In 2022, the Company increased its ownership interest in Yanacocha to 100% by acquiring Buenaventura’s 43.65% noncontrolling interest and Sumitomo’s 5% noncontrolling interest. |
|
|
(33) |
Sites acquired through the Newcrest transaction. Gold reserves at sites acquired through the Newcrest transaction were estimated at a gold price of $1,300 per ounce, with the exception of Lihir, for which gold reserves were estimated using Newmont’s price assumptions, and certain legacy estimates, which have applied older, more conservative price assumptions. |
Contacts
Media Contact
Jennifer Pakradooni
[email protected]
Investor Contact – Global
Neil Backhouse
[email protected]
Investor Contact – Asia Pacific
Christopher Maitland
[email protected]