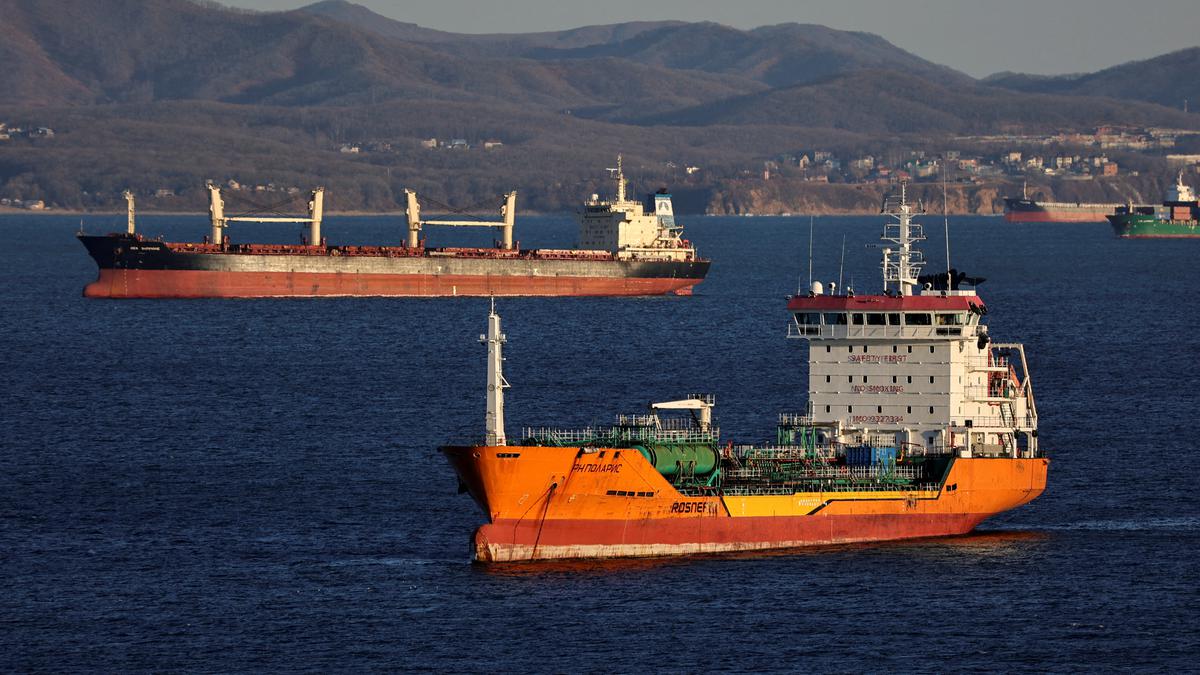
The crude oil tanker RN Polaris and a bulk carrier sail in Nakhodka Bay near the port city of Nakhodka, Russia,
| Photo Credit: Reuters
Yemen’s Iran-backed Houthis have been targeting vessels in the Red Sea since November to show their support for the Palestinian Islamist group Hamas in its war against Israel. This has prompted major shipping companies to take the longer and costlier route around Africa’s Cape of Good Hope rather than through the Suez Canal. This is a cause for concern for India as it is a major importer of crude oil from Russia and a significant player in the export of petroleum products to Europe, both of which require transportation through the Suez Canal.
Also read:Houthi attacks: a threat to global shipping?
According to a recent Reuters report, at least four tankers transporting diesel and jet fuel from West Asia and India to Europe are taking the longer route around Africa to avoid the Red Sea. The diverted vessels were carrying a combined 2.4 million barrels of diesel and jet fuel.
India is increasingly becoming a significant player in the petroleum products export market. In May last year, data analytics firm Kpler reported that India became Europe’s largest supplier of refined fuels. In the ongoing and previous financial years, the Netherlands was the biggest importer of India’s refined fuels. In FY23 and FY24 (April-October), the country bought about $19,300 million worth of refined fuel from India.
These northbound oil shipments reach Europe via the Suez Canal.
Chart 1A | The chart shows northbound crude oil and petroleum product volumes from origin countries transiting the Suez Canal and the SUMED pipeline (which transports crude oil north through Egypt). 1H23 – first half of 2023
Charts appear incomplete? Click to remove AMP mode
India was the third biggest player in terms of petroleum product volumes sent north in the first half of 2023.
Chart 1B | The chart shows the destination countries of the northbound crude oil and petroleum product volumes transiting the Suez Canal. 1H23 – first half of 2023
In the first half of 2023, the Netherlands was the single largest importer of such products, most of which came from India.
These two charts show the significant impact that the attacks on commercial ships in the Red Sea can have on India’s petroleum product exports. Both show million barrels per day of oil shipments.
Click to subscribe to our Data newsletter
An even bigger worry for India is the record amount of crude oil it imports from Russia. In FY24 (April-October), India imported over $26,900 million worth of crude oil from Russia — its biggest source of oil this year — with Iraq featuring a distant second ($15,582 million). A majority of this crude oil is arriving through the Suez Canal southbound to India.
Chart 2A | The chart shows southbound crude oil and petroleum product volumes from origin countries transiting the Suez Canal, in million barrels per day. 1H23 – first half of 2023
In FY23 and FY24 (April-October), southbound supply of crude oil from Russia through the Suez Canal grew exponentially.
Chart 2B | The chart shows the destination countries of the southbound crude oil and petroleum product volumes transiting the Suez Canal. 1H23 – first half of 2023
Most of the southbound crude from Russia went to India followed by China in FY23 and FY24 (April-October). These two charts show the potential impact that the escalating tensions in the Red Sea can have on India’s crude oil imports from Russia and other countries which use this route.
Reports show that refiners in India are looking to increase supply from West Asia as otherwise, the cost of imports may rise given the risk involved in transporting oil through the Suez Canal. With retail fuel costs already at a historical high in India, and the general elections approaching, it remains to be seen how this situation will unfold.
With inputs from Reuters, AP and the U.S. Energy Information Administration
Source: The charts were sourced from an article titled ‘Red Sea chokepoints are critical for international oil and gas flows’ published by the U.S. Energy Information Administration
Also read |Data | 17% of cargo that sailed southbound on the Suez Canal in 2019 went to Indian ports
Listen to our podcast | How Turkey’s economic and political trajectory compares to India | Data Point podcast